 Sparkplot Studio
Executive reportPro
Annual operations review · revenue trend
Insight report in a dark navy brand kit: cover, a short summary, three key numbers, then an area chart with its written insight. 4-page PDF.
Charts, reports & data stories from a spreadsheet
Upload a spreadsheet. Get charts, a client-ready report and an interactive data story, in your brand.
Charts are drawn on your device. Your rows stay in your browser unless you save a project. How that works
Before / after
Drag the handle, or focus it and use the arrow keys. Left: the chart a spreadsheet gives you. Right: what Sparkplot draws from the same six months of leads, with a headline that says what happened.
See it work
Five steps in the Studio, shown with the coffee-roaster sample loaded. These are screenshots of the app as a Free visitor sees it, not mock-ups.
CSV or Excel, read in your browser. Sparkplot shows which columns it found (dates, money, numbers) and a preview of the rows, so you can check before going further.
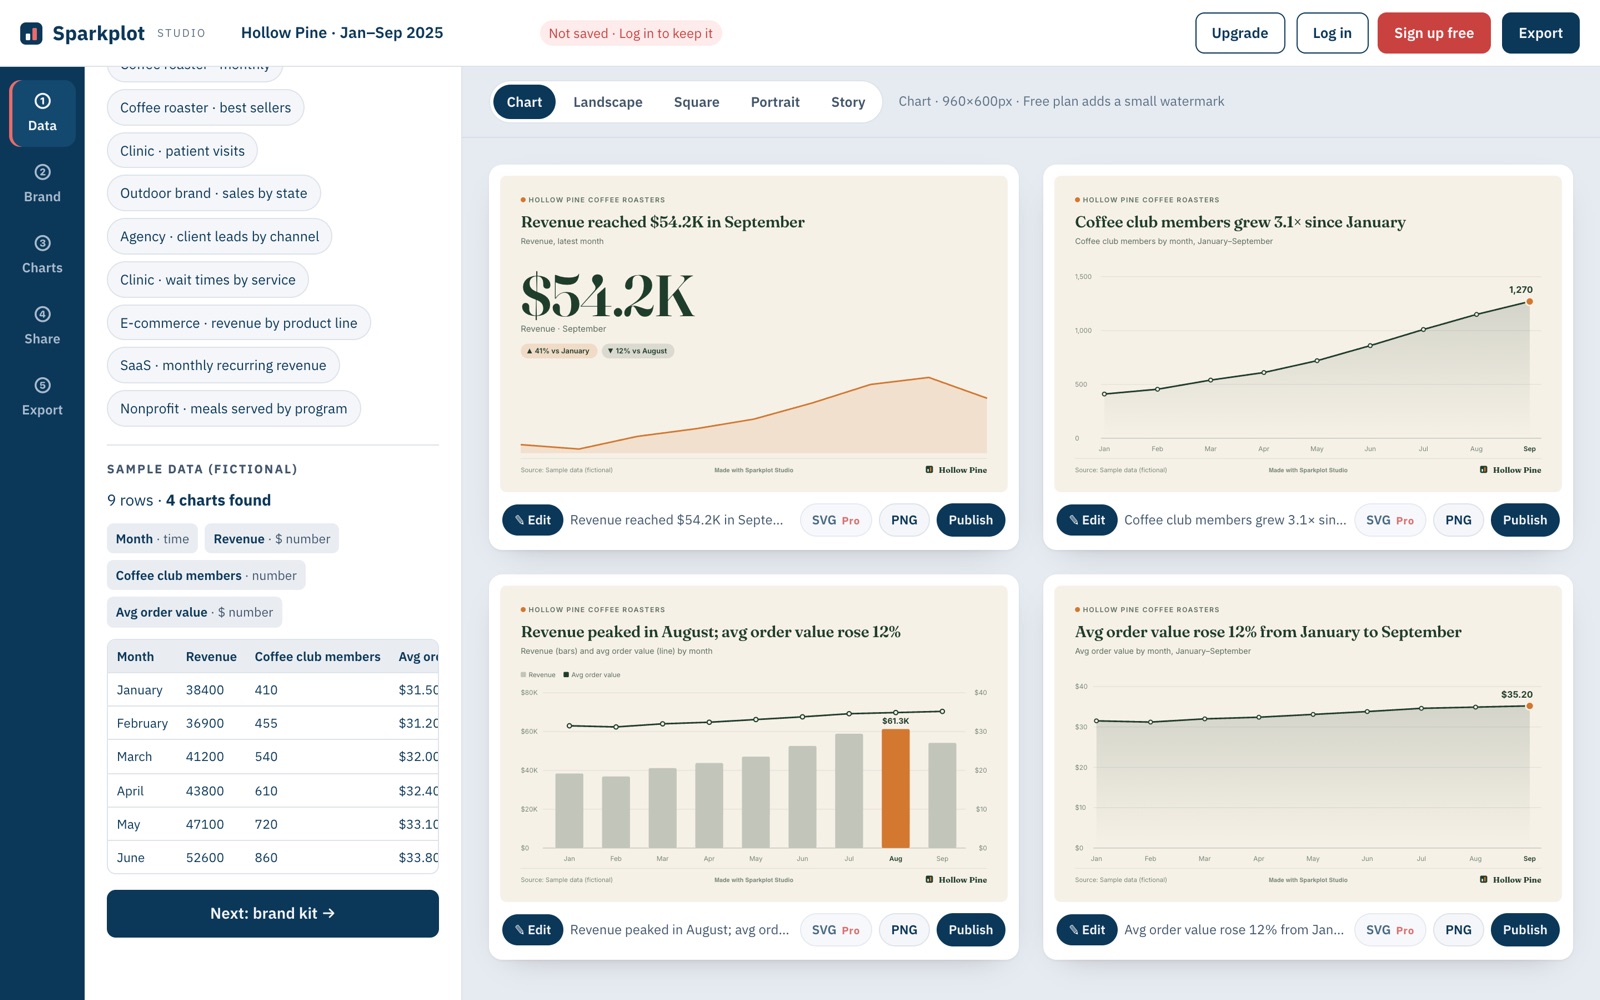
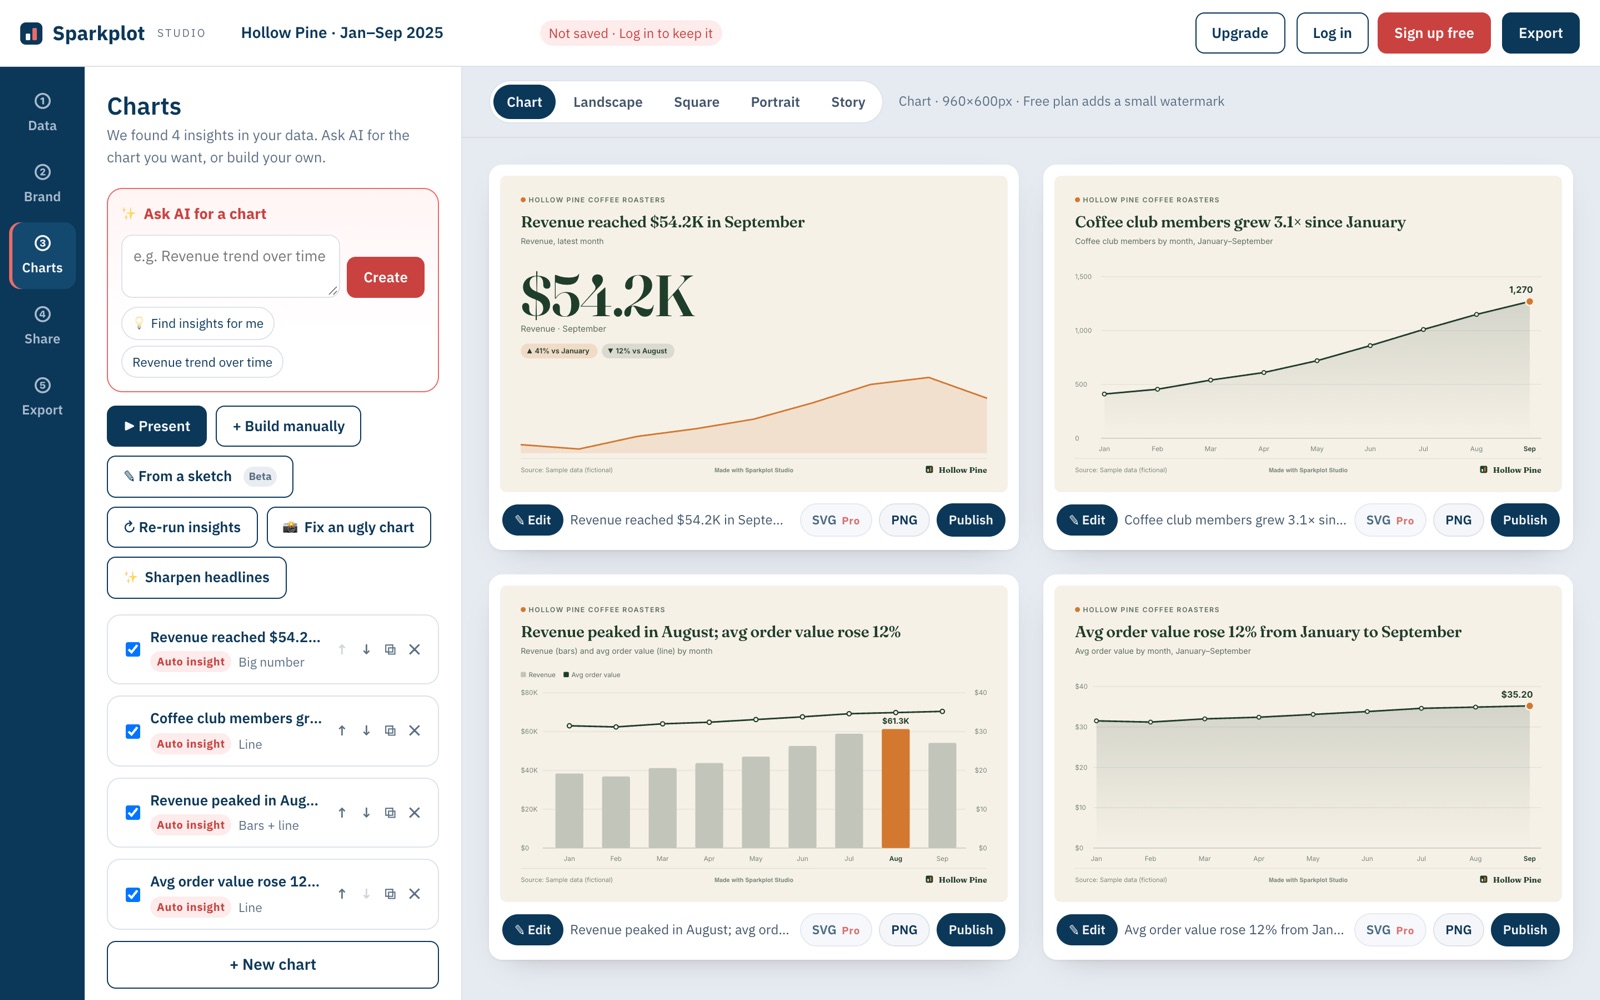
The app ranks what the data shows and drafts up to six charts. Each headline is written from the numbers, like “Coffee club members grew 3.1× since January.”
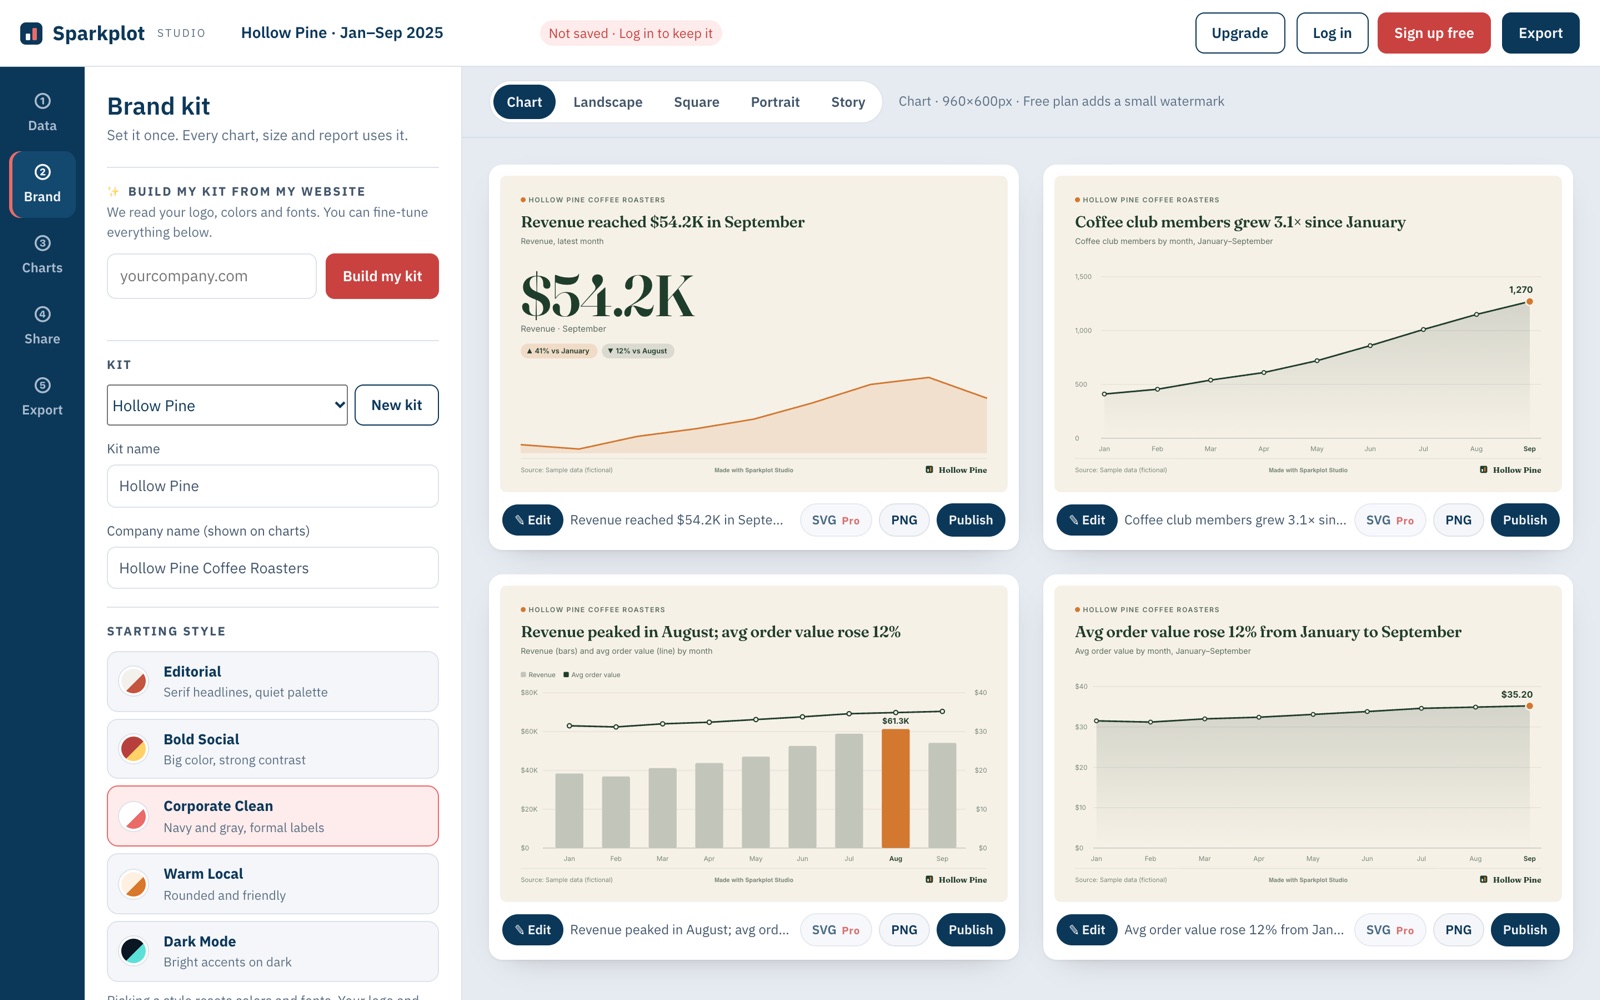
Paste your website to pull your logo, colors and fonts, or start from a style and set them yourself. Every chart, size and report updates at once.
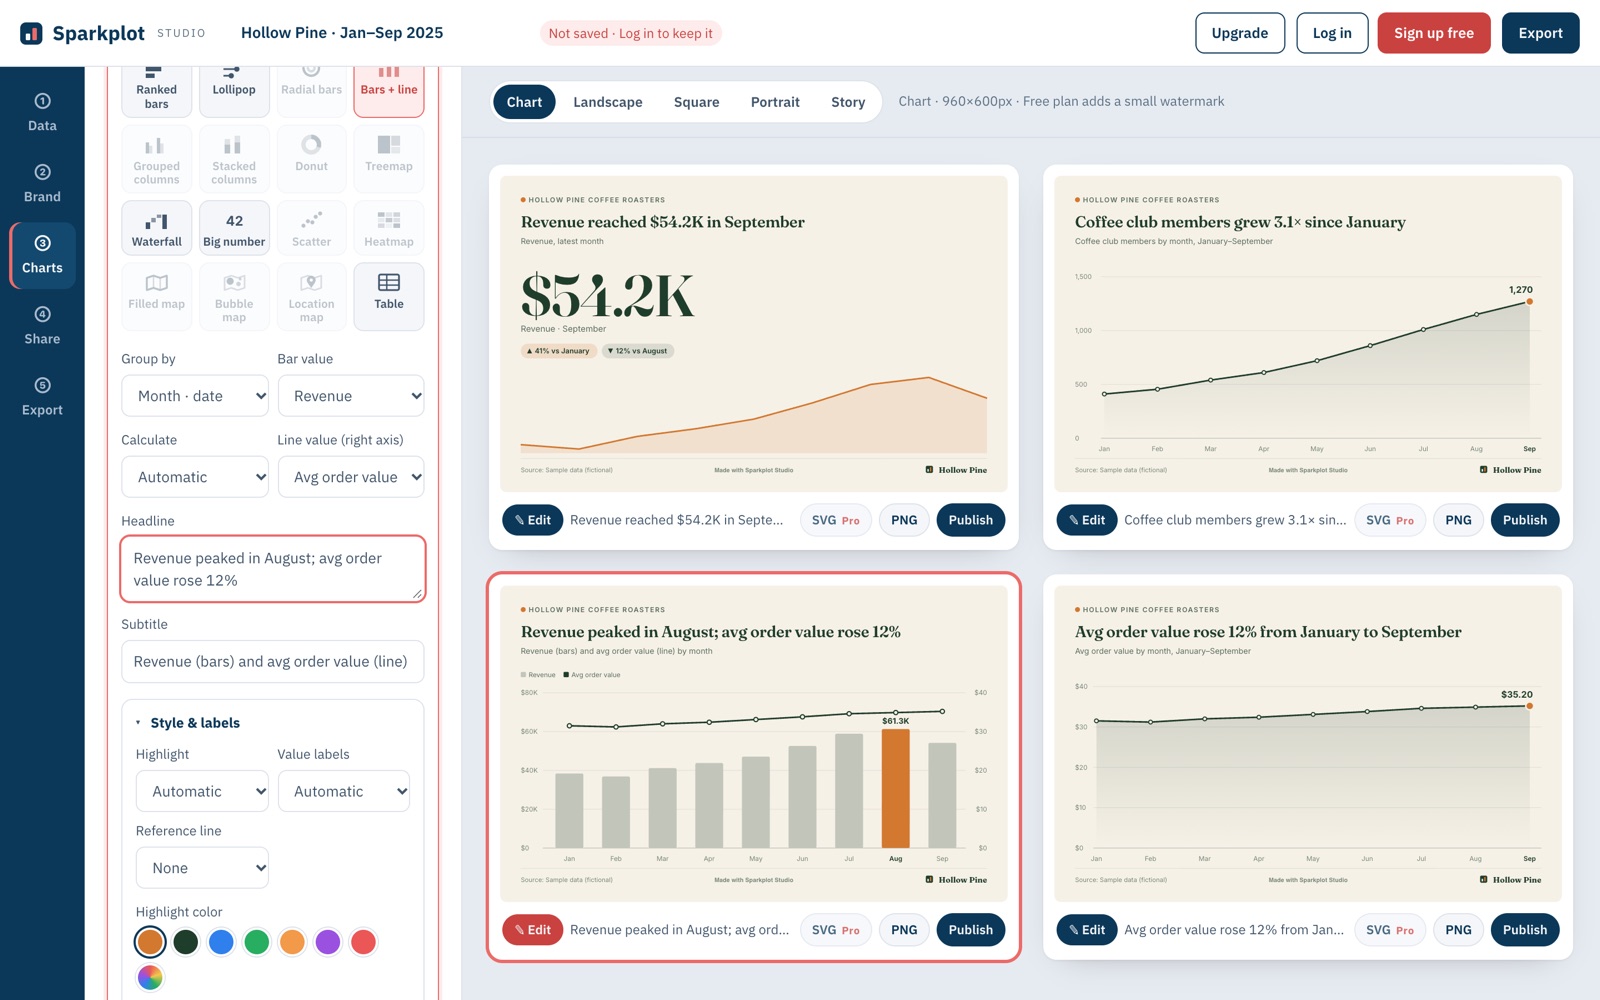
Switch between 20 chart types, change columns and the calculation, highlight a bar, add an average or target line, and rewrite the headline.
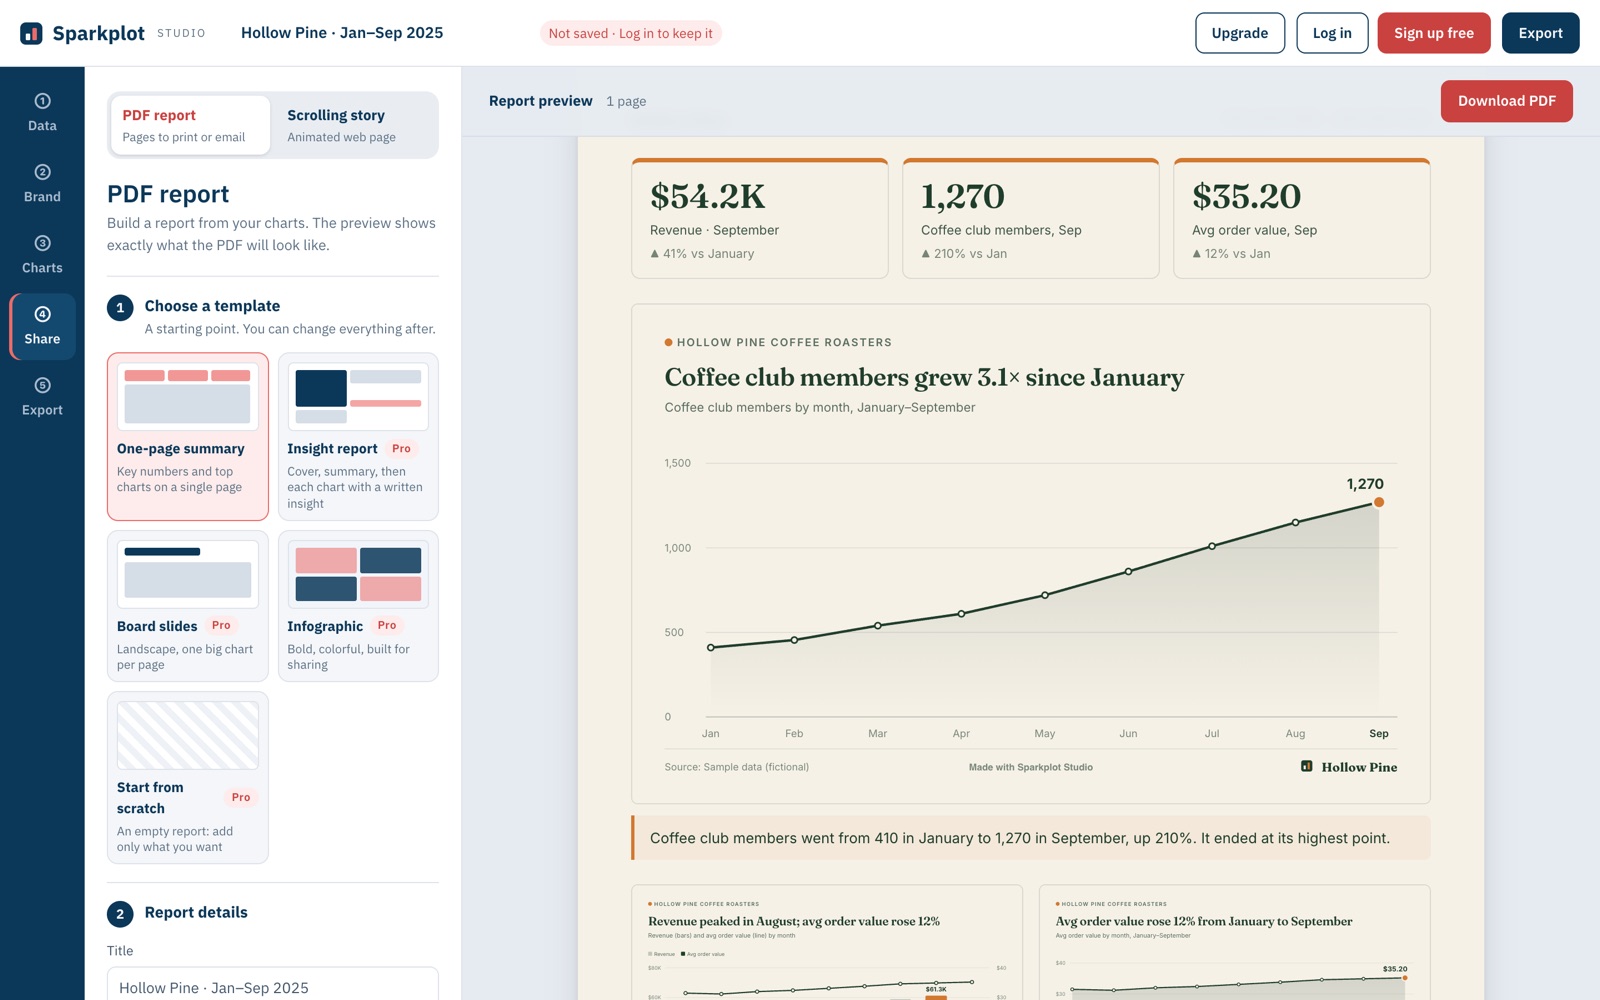
Pick a template and the preview shows the PDF page by page. Free makes one-page reports; multi-page reports and board slides are part of Pro.
Finished work
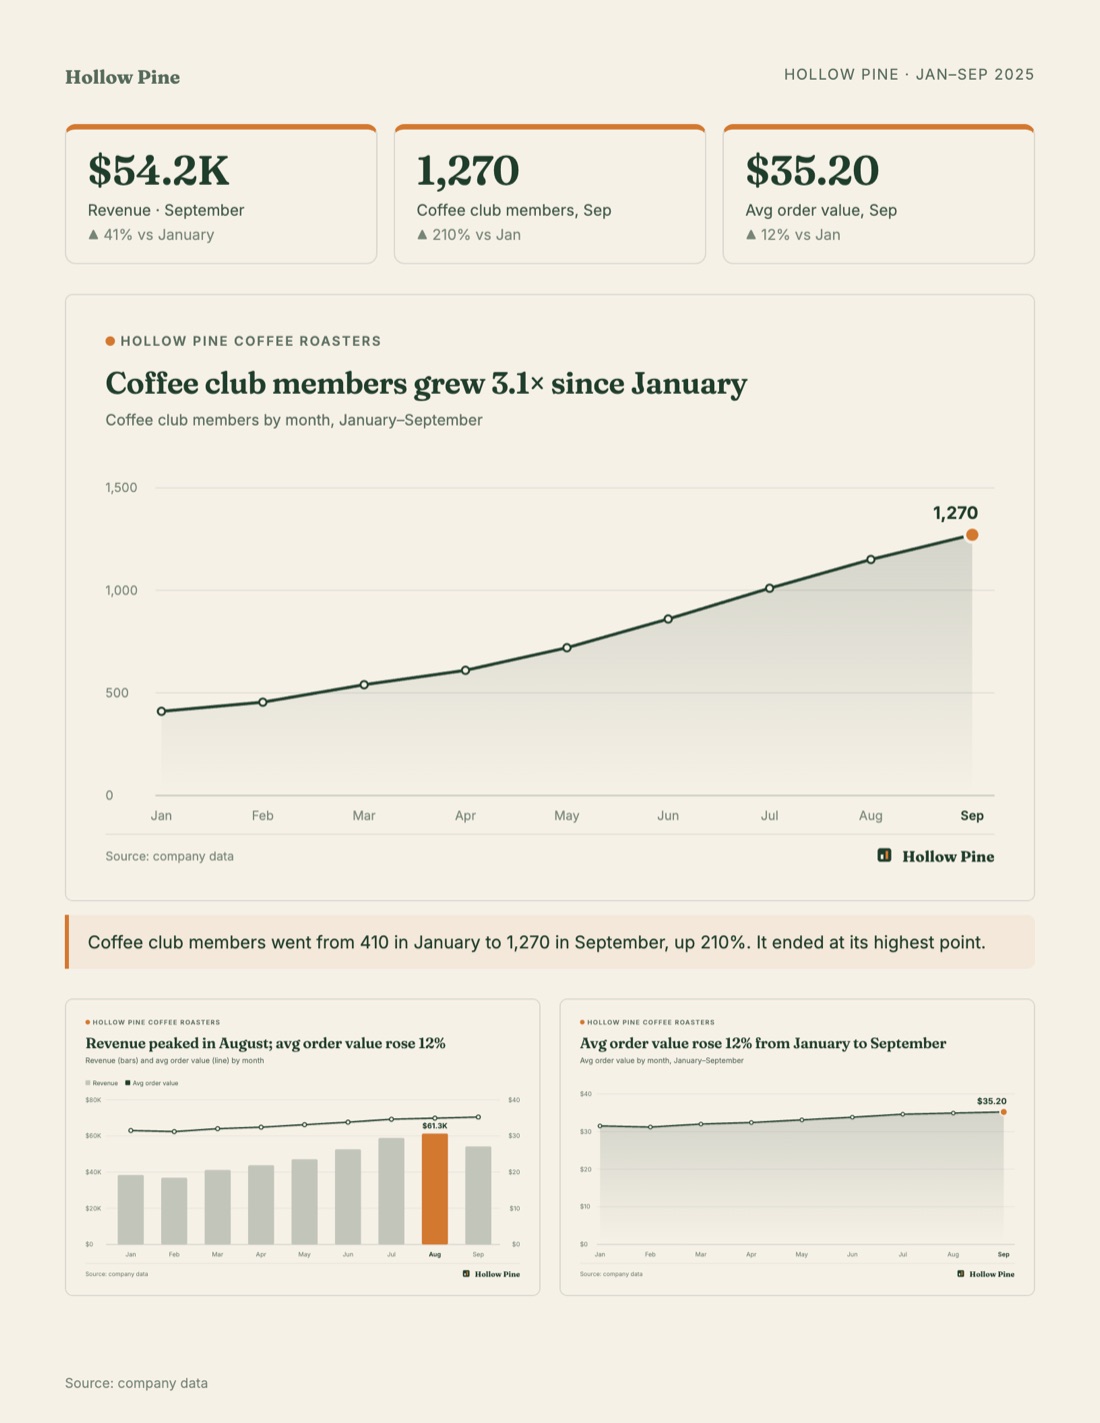
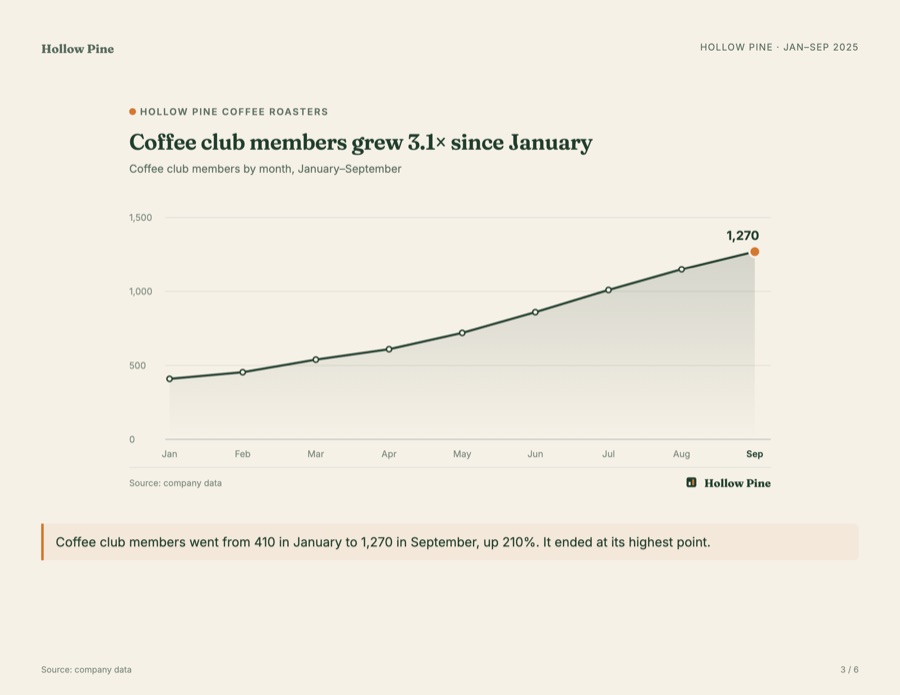
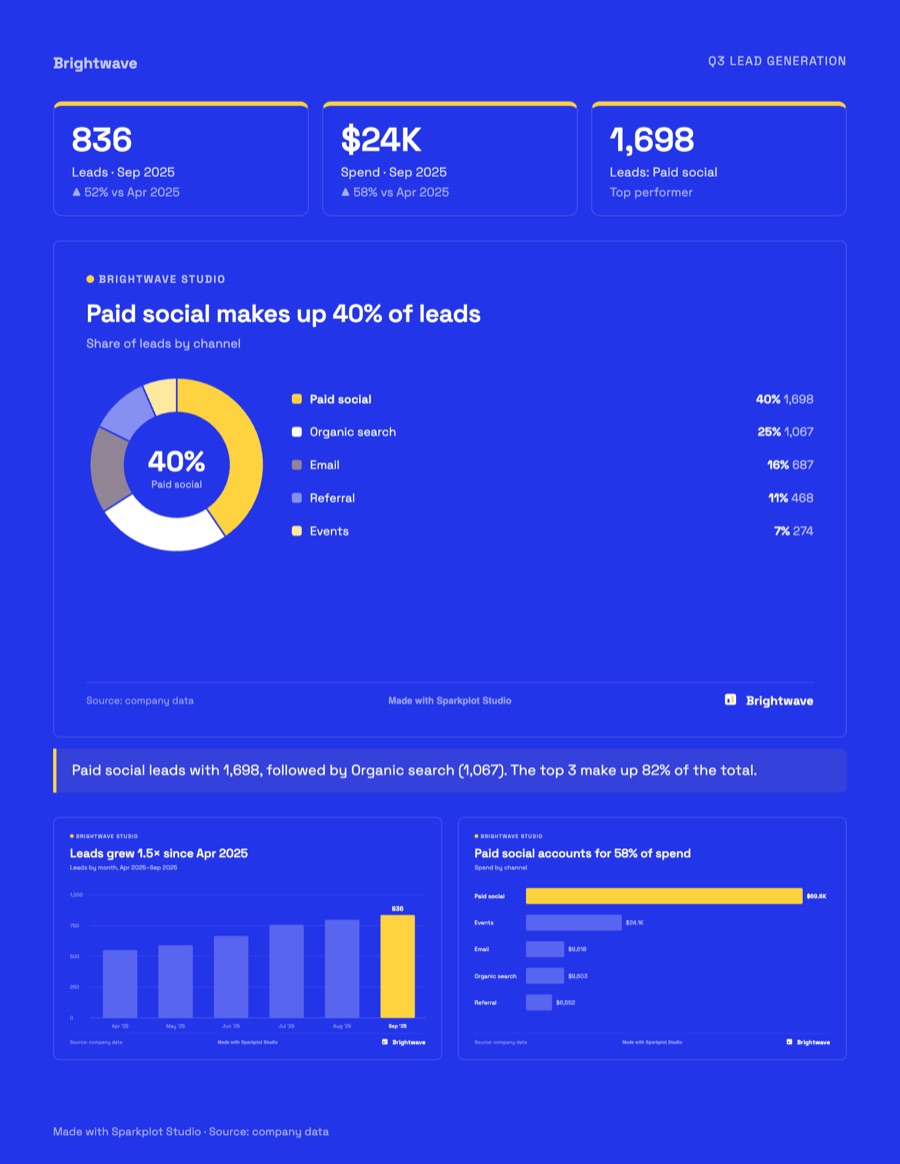
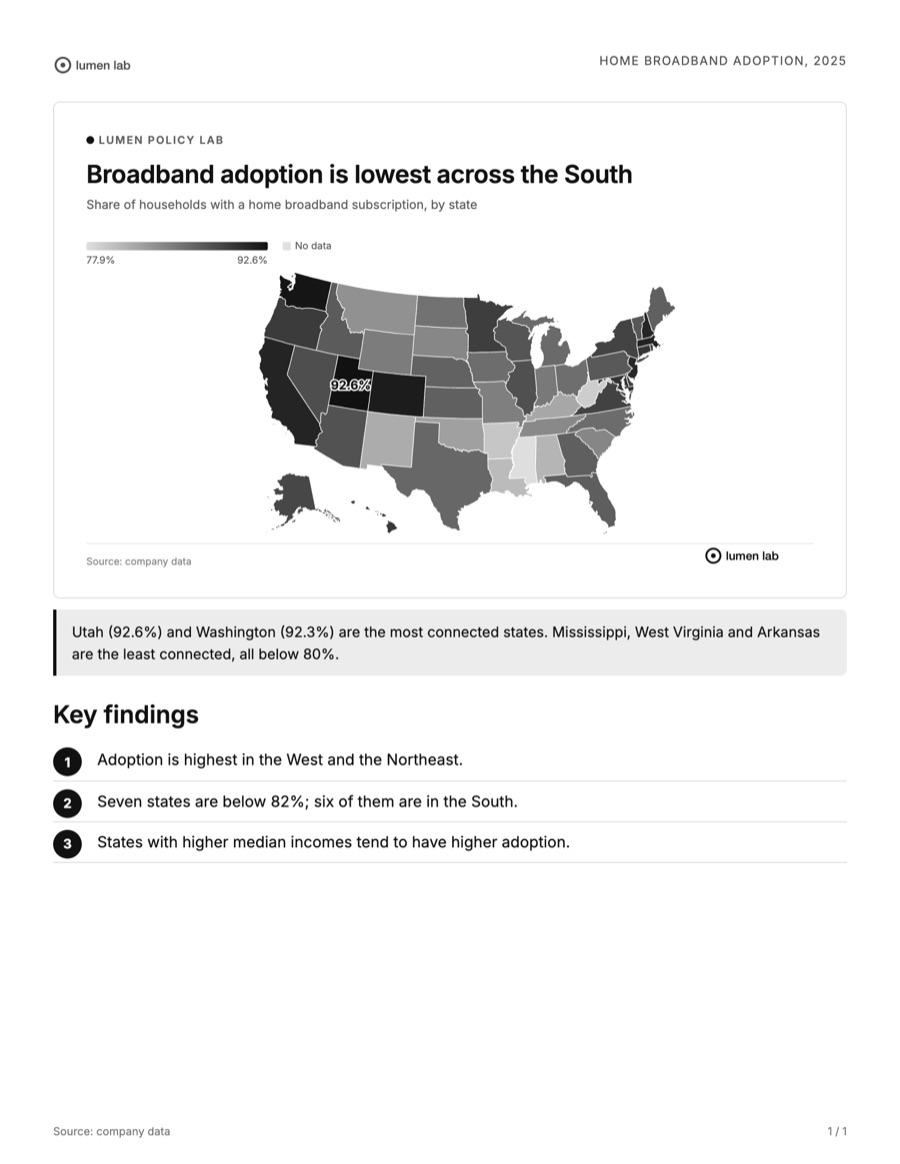
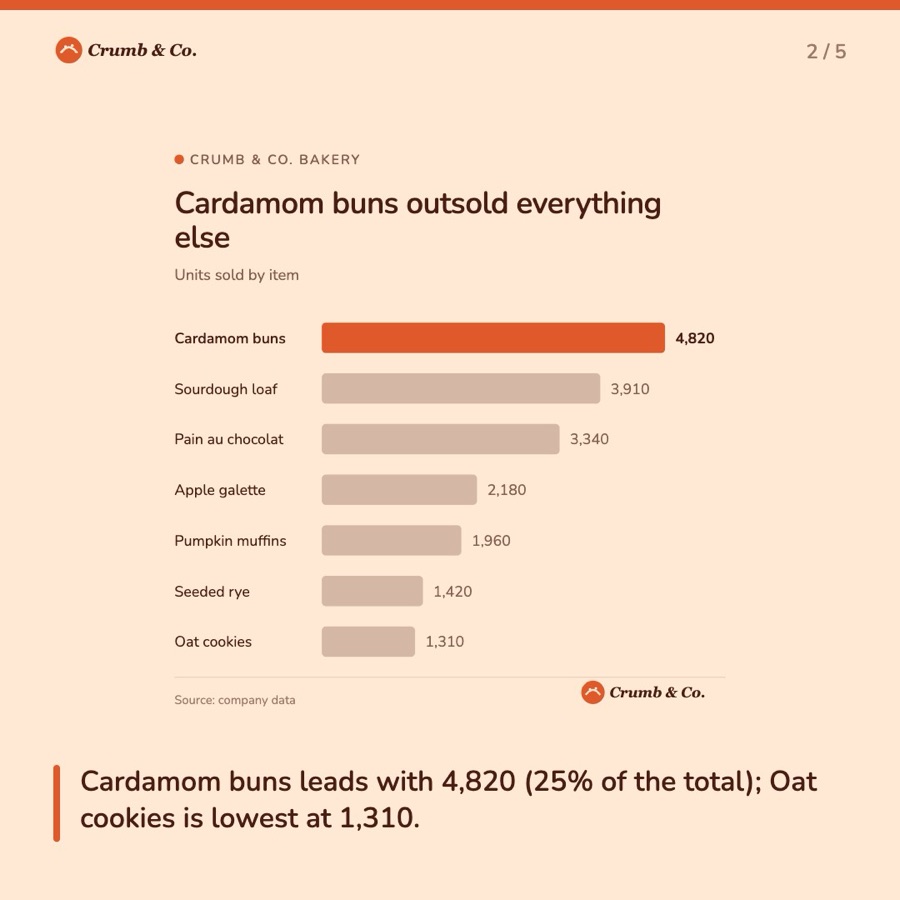
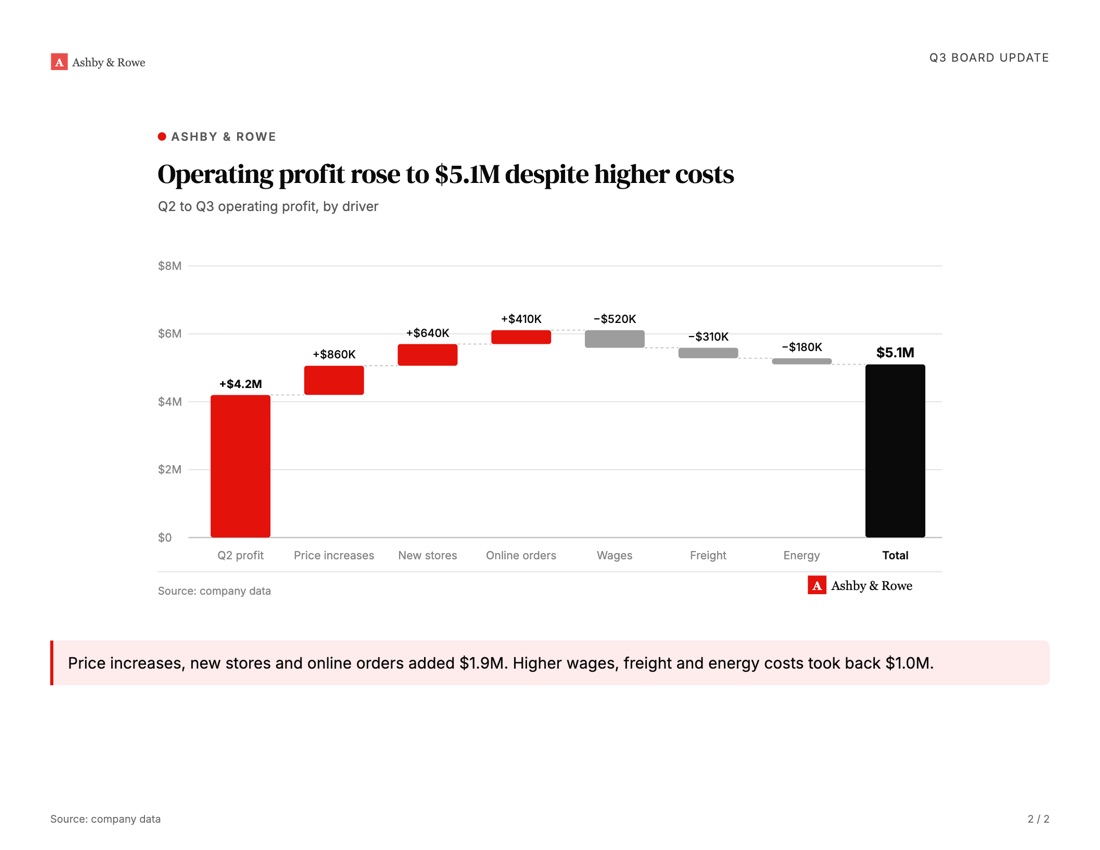
Reports, summaries, stories and slides, each designed in its own brand. Click any one to see it full size.
Built for the way you work
Each example uses one of the samples. Open it in the Studio and swap in your own spreadsheet.
Explore before you sign up
Both files were made in the Studio. Open them, scroll them, download them.
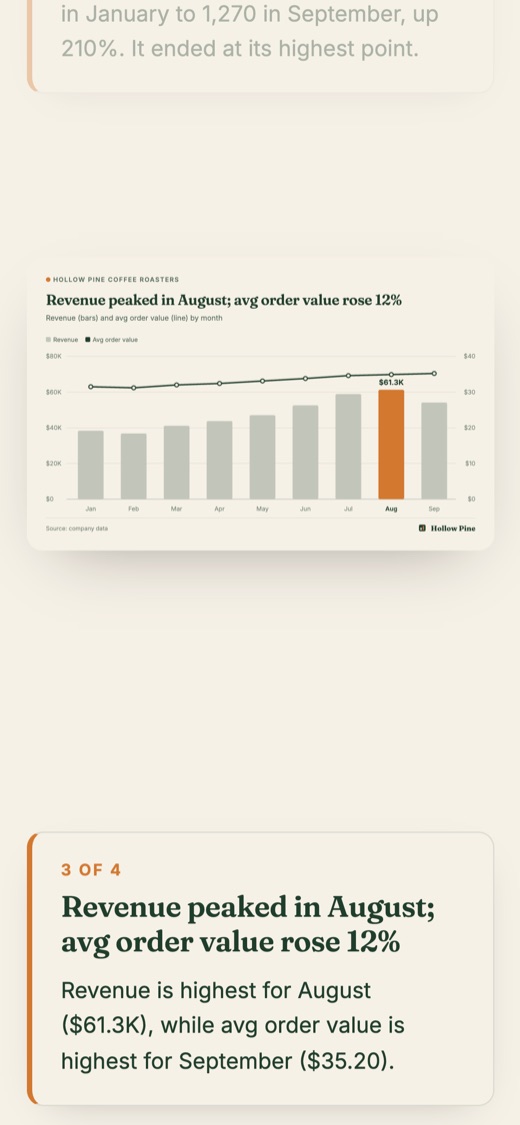
Sample · scrolling story
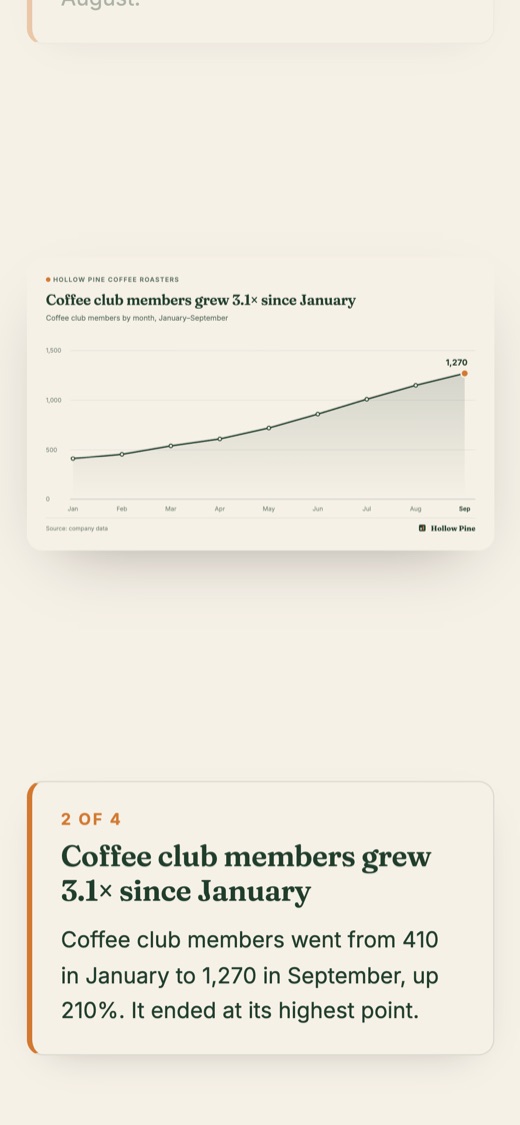
Four charts that draw themselves as you scroll. This is the file the Studio’s “Download HTML” button produces (a Pro feature).
Open the sample story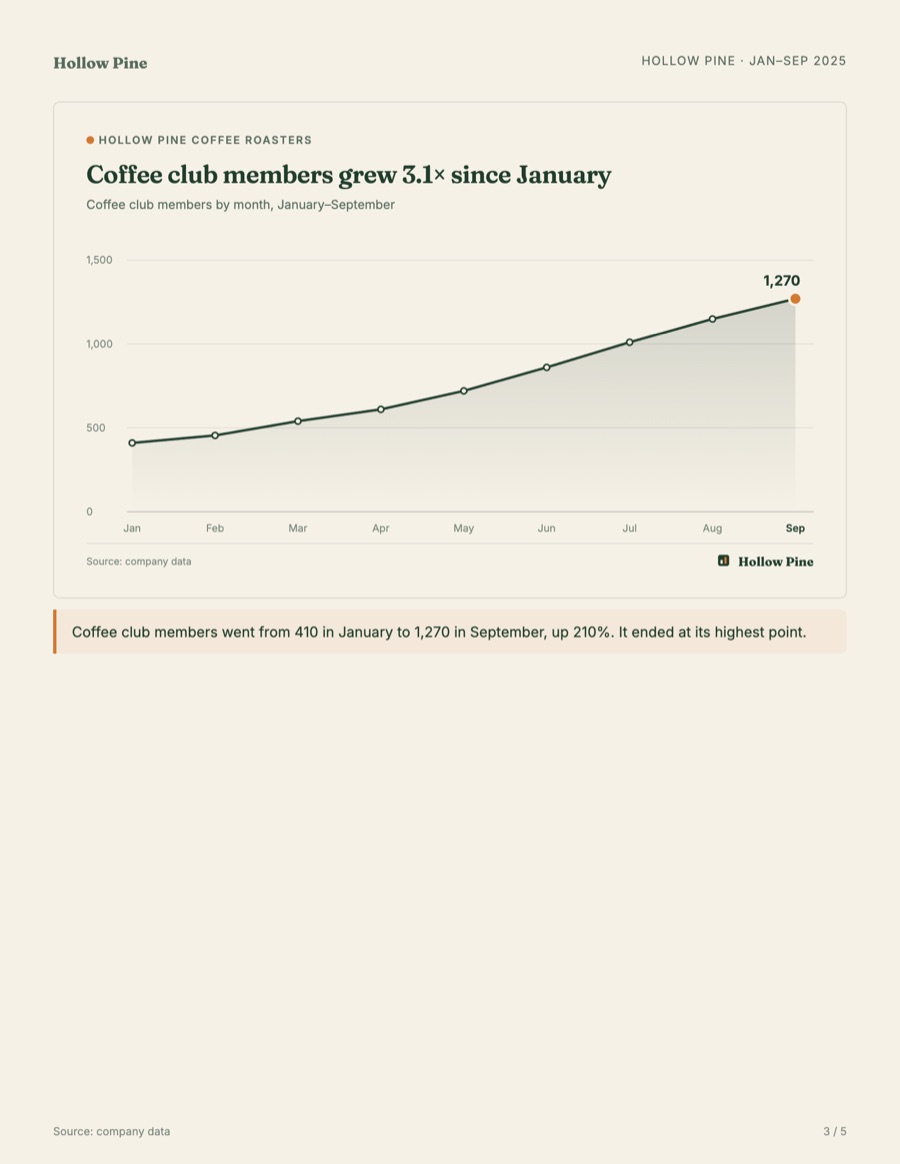
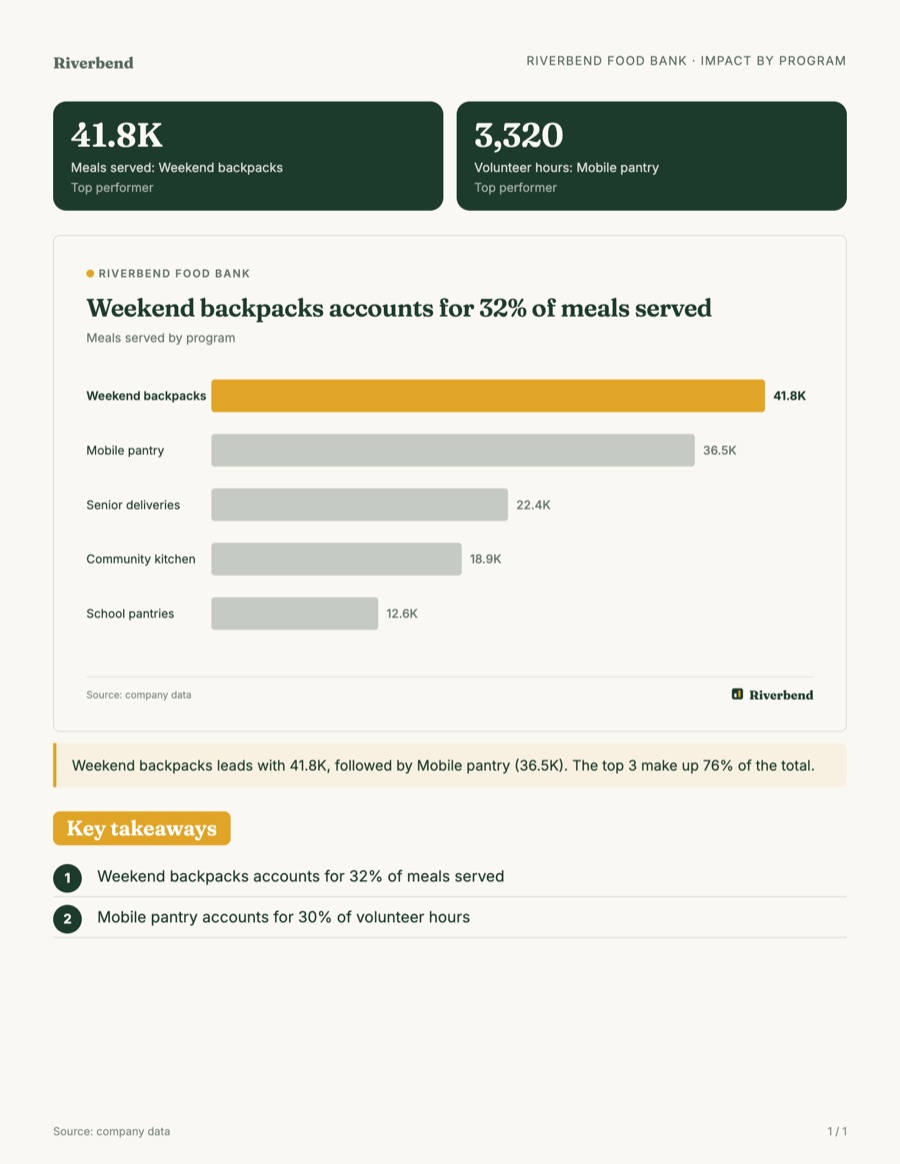
Sample · PDF report
A 5-page Insight report: cover, key numbers and takeaways, then one chart per page with a written insight. Saved as PDF from the report builder.
Open the sample PDFAlso: LinkedIn carousel PDF from the same project.
What changes
Four outcomes, each from a feature you can try today.
Your logo and fonts on every file. Uploaded fonts are embedded in SVG and PNG exports, so text never falls back to a default.
Brand kit · logo & font uploads Pro
Headlines state the finding and are written from the chart’s numbers. AI headline suggestions are rejected if they use a figure that isn’t in the data.
Auto headlines · Sharpen headlines
One kit drives charts, reports, slides, stories, carousels and video. Change a color once and every format follows.
Brand kit · build from your website
One upload, every size: 960×600 chart, 1200×628 landscape, 1080×1080 square, 1080×1350 portrait and 1080×1920 story, in one ZIP.
Free: Chart + Square · all five sizes Pro
Brand
The same chart from the same data in three brand kits, drawn live on this page by the Studio’s chart engine.
Live demo
Dates become trend lines, categories become ranked bars, states and countries become maps. Hover any chart for exact values. Change the brand and every chart updates at once. Nothing is uploaded.
Privacy by design
Sparkplot reads your spreadsheet and draws every chart on your own device. There’s no upload step, so customer lists, transactions and patient data stay where they are.
CSV and Excel files are parsed in the browser, and the charts, PDFs and Tableau and Power BI kits are built there too.
Ask AI gets column names, types and ranges. Headline help gets the totals a chart already shows. Then every number is checked against your data.
Use it without an account and nothing is stored on our servers. Log in only if you want projects saved to your private workspace.
In the Studio, a linked Google Sheet is read by your browser directly from Google, not through us.
Exception 1
If you log in and save a project, its data is stored in your private account so you can open it again. Only you can see it, and deleting your account removes it.
Exception 2
To send a scheduled report, our server reads your Google Sheet and rebuilds the charts. We keep the chart images and the latest numbers per chart, not the sheet itself.
Read the full privacy policy.
Pricing
Free has everything you need to try it with your own data. Pro adds your own logo and fonts, every size and format, and removes the Sparkplot mark. Or hand it to us.
Free
$0 forever
For trying it out and quick charts.
Pro Most popular
$27 / month
Billed monthly. Cancel anytime.
$27 billed every month
Studio service
from $300
Done for you, by a data-viz designer. Quoted per project.
Free vs Pro · limits as enforced in the app today
| Feature | Free | Pro |
|---|---|---|
| Create | ||
| Charts, maps & tables | Unlimited, all 20 chart types | Unlimited, all 20 chart types |
| Auto insights | Up to 6 starter charts per dataset | Up to 6 starter charts per dataset |
| AI requestsAsk AI, Sharpen headlines | 20 a dayneeds a free account | 300 a day |
| Saved projects | 3 | Up to 500 |
| Present mode | ✓watermark stays on | ✓ |
| Brand | ||
| Brand kits | 1 | Up to 50 |
| Styles, colors & library fonts | ✓ | ✓ |
| Brand kit from your website | ✓ including the logoreplaces your one kit | ✓ a new kit each time |
| Upload your logo & fonts | — | ✓ |
| Watermark | Small “Made with Sparkplot Studio” | None |
| Export | ||
| PNG sizes | Chart and Square | All five: Chart, Landscape, Square, Portrait, Story |
| Editable SVG | — | ✓ |
| ZIP of every chart | ✓ | ✓ |
| PDF reports | 1-page reports | Multi-page reports, board slides, infographic |
| Video (MP4) | 1:1, up to 3 charts, watermark | 9:16, 1:1 and 16:9, up to 12 charts, your own closing card |
| LinkedIn carousel (PDF) | Watermarked preview | Download, with AI-written copy |
| Tableau workbook & Power BI kit | — | ✓ |
| Share | ||
| Publish & embed charts | ✓ with a “Made with Sparkplot Studio” link | ✓ no attribution |
| Scrolling story | Build & preview | Publish, embed, download HTML |
| Google Sheets connection | — | ✓ refresh in one click |
| Scheduled report emails | Needs a connected Google Sheet (Pro)The Free limit is monthly, to yourself | Weekly or monthly, up to 5 recipients |
Pro is $27 billed monthly, or $264 billed once a year ($22 a month). Same features either way. The Studio service is quoted separately and doesn’t need a subscription.
FAQ
Unlimited charts, maps and tables in all 20 chart types, auto insights, one brand kit (five styles, your colors, and a kit built from your website), PNG downloads in Chart and Square sizes, 1-page PDF reports, published chart embeds, and Ask AI 20 times a day with a free account. Free files carry a small “Made with Sparkplot Studio” mark. Compare every feature.
No. You can make charts, download PNGs, publish chart embeds and build a 1-page report without one, and nothing is stored on our servers. A free account is needed for the AI features and to save projects (Free saves up to 3).
Your spreadsheet is read and charted in your browser. The demo and the Studio don’t upload your rows to make charts, and AI features get column summaries or chart totals only. Two exceptions: projects you save while logged in are stored in your private account, and scheduled report emails read your Google Sheet through our server. For done-for-you work we can use anonymized or aggregated data if your files are sensitive. See the privacy policy.
When you ask for a chart: a summary of your columns (names, types, ranges and a few example labels), never your rows. When you sharpen headlines or build carousel copy: the totals the chart already shows. Headlines are written by the app from your real numbers, and AI headlines that use a figure not in the chart are rejected.
CSV and Excel (.xlsx, .xls, .xlsm), and OpenDocument spreadsheets (.ods). Anything with labels and numbers works: monthly sales, survey results, program metrics, campaign performance. Workbooks with several sheets let you switch between them. On Pro you can also connect a Google Sheet shared by link, and your charts update when you refresh.
Same Pro features either way. Monthly is $27, billed each month. Yearly is $264, billed once a year, which works out to $22 a month.
Yes. Pro is a subscription you manage from “Manage billing” in your account, which opens Stripe’s customer portal, where you can cancel. Files you’ve already downloaded are yours to keep.
Yes, the Studio is free to use with unlimited charts and a small “Made with Sparkplot Studio” mark. Pro is $27 a month, or $22 a month billed yearly. It removes the mark and adds your own logo and fonts, every size, editable SVG files, multi-page reports and slides, published scrolling stories, and the Tableau workbook and Power BI starter kit.
Yes. In the Studio, paste your website or set colors yourself on any plan. Uploading your own logo and font files is part of Pro, and uploaded fonts are embedded in SVG and PNG exports so text never falls back to a default. For done-for-you work, send your brand guide and font files once.
In the Studio, headlines and written insights are generated from the chart’s own numbers, and AI suggestions are rejected if they contain a figure that isn’t in the data. You’re still responsible for the data you upload. For done-for-you work, we check every file against your source data before delivery: values, labels, spelling and brand colors.
Yes. Switch any chart’s type, columns and calculation, restyle it, or ask for a new one in plain English. For custom work, tell us something like “make chart 2 a bar chart” and you’ll get updated files back.
Yes. We build custom charts, reports, slide decks and Tableau or Power BI dashboards from your data, in your brand. Projects start at $300. Request a quote.
Done for you
Custom charts, report designs and live dashboards, built by hand from your data and in your brand. Projects start at $300.
Start with a sample or your own spreadsheet. No card, no install.